For decades, Singapore’s commercial building managers made waste collection decisions the same way: schedules based on habit, intuition, or worst-case estimates from the previous quarter. Collection trucks arrived on-site whether bins were full or half-empty. Overfilling incidents were managed reactively. Nobody had a clear picture of actual waste volumes moving through the building on any given day.
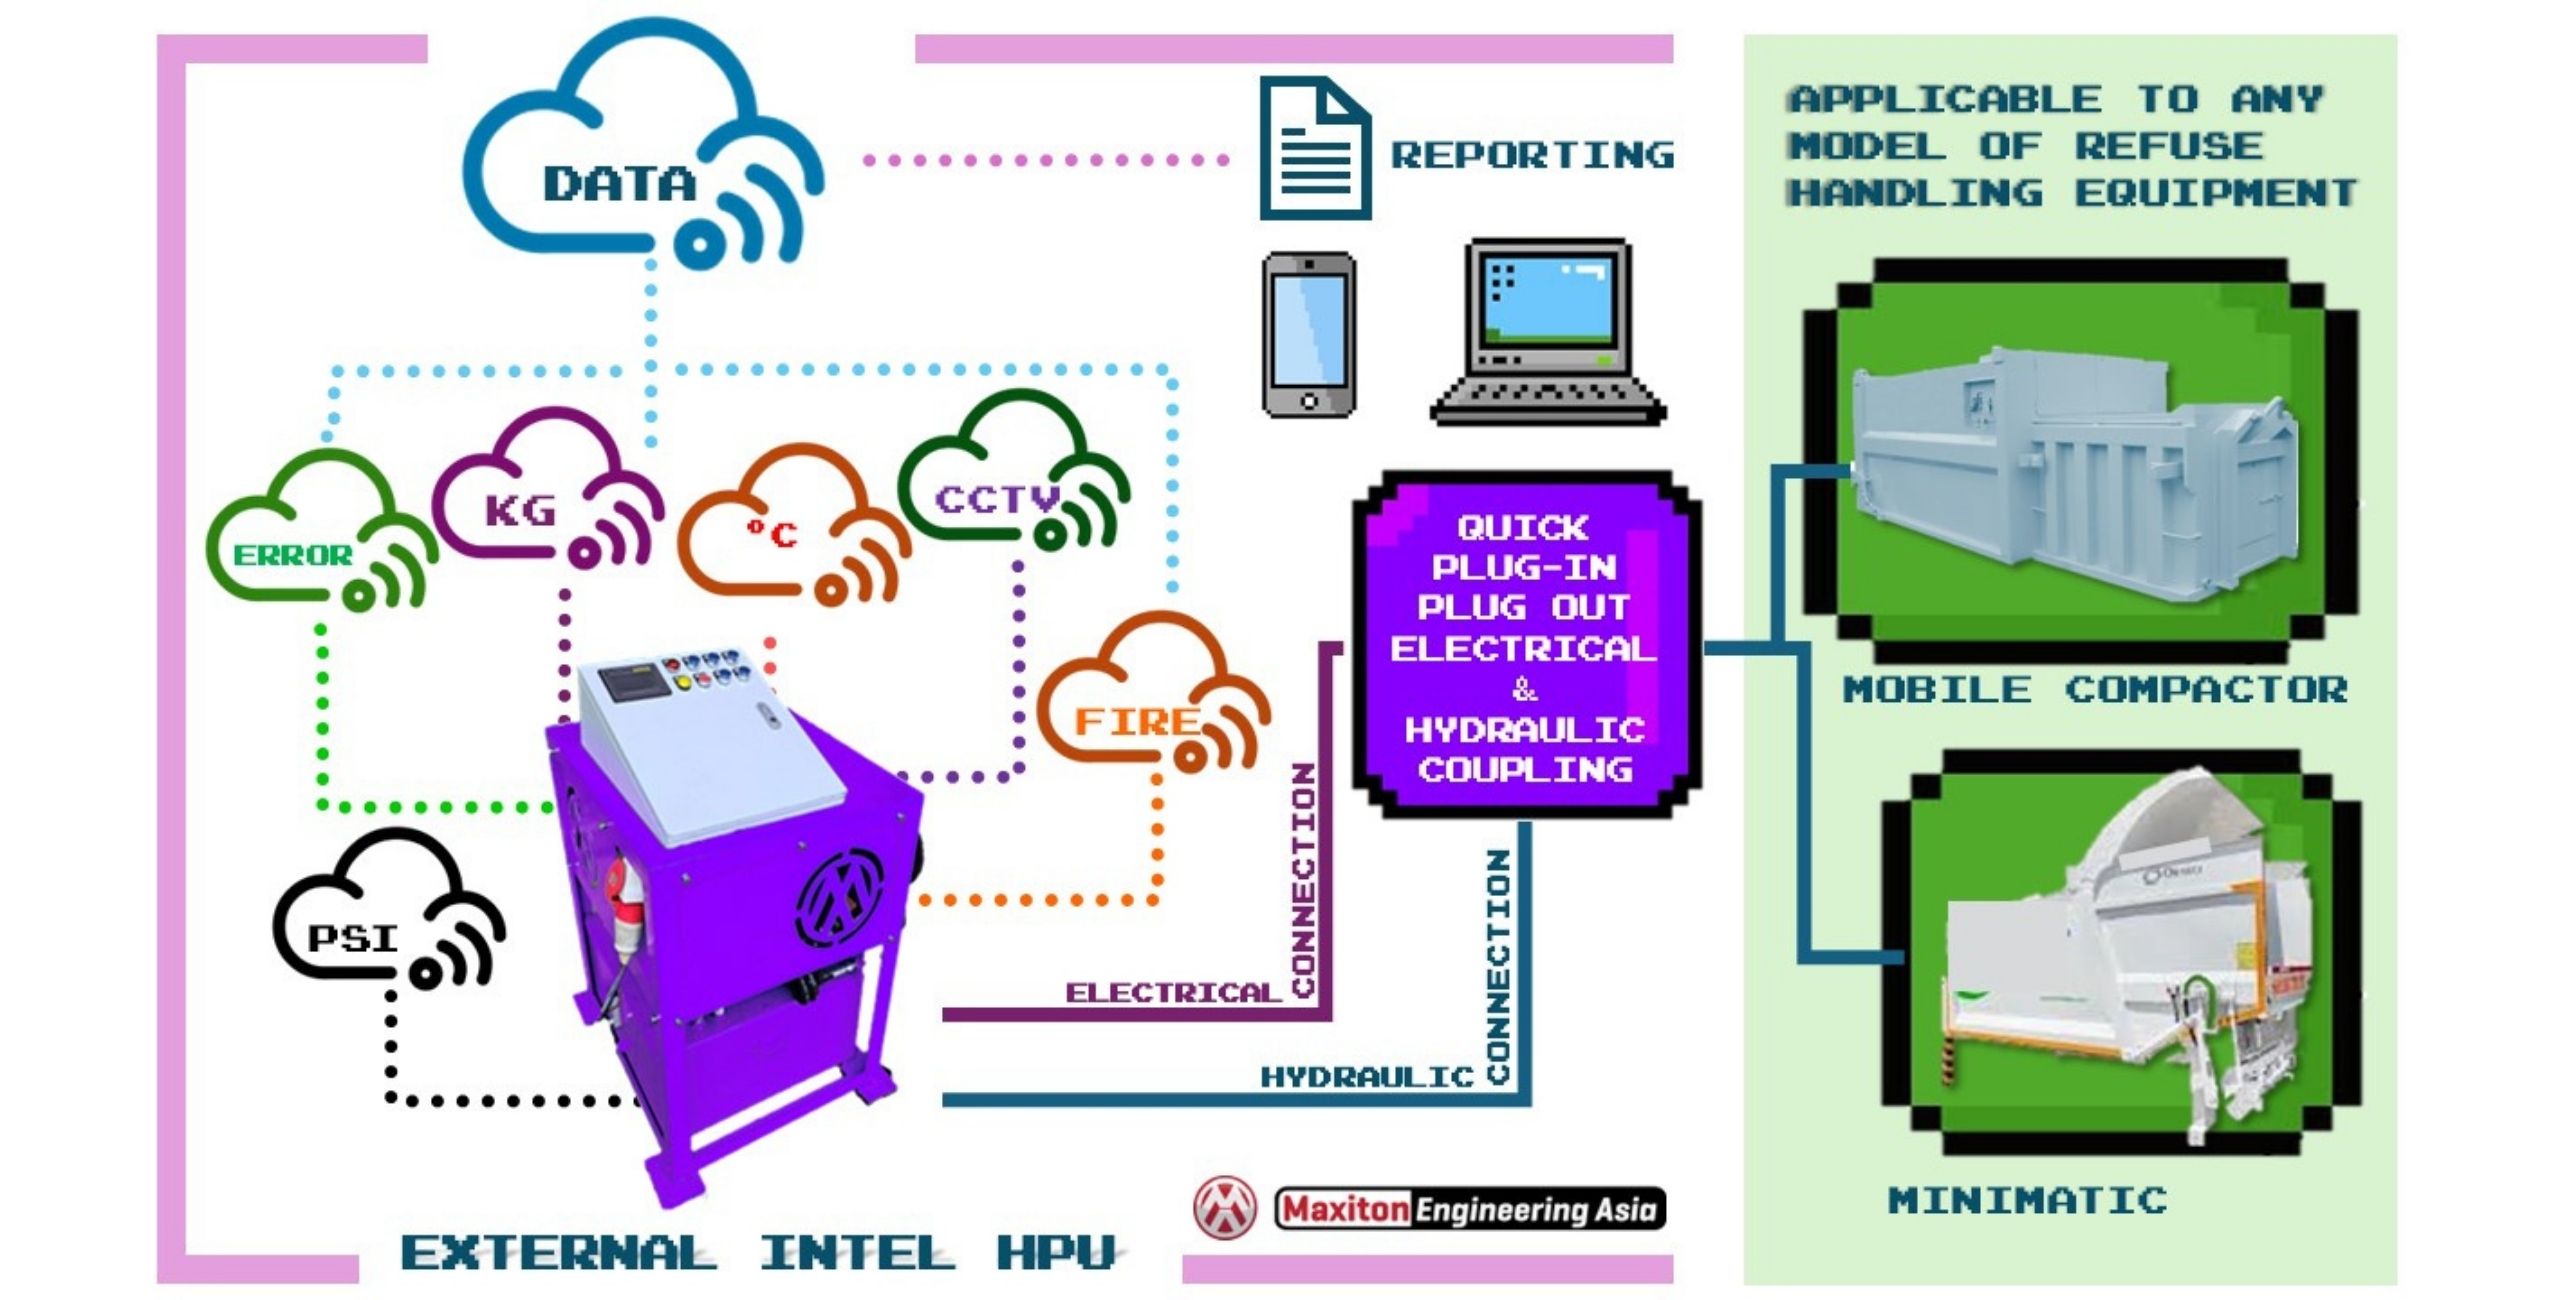
IoT-enabled waste compactors have changed that equation fundamentally. By continuously measuring fill levels inside compactor chambers, connected sensors generate a continuous stream of data that — when properly analysed — enables building managers to forecast waste volumes with a precision that was previously impossible.
Here is how fill-level data works, what it reveals, and how Singapore facility managers are using it to cut costs and reduce operational surprises.
What IoT Fill-Level Sensors Actually Measure
Fill-level sensors mounted inside a waste compactor chamber use ultrasonic or radar technology to measure the distance from the sensor to the waste surface. Each compaction cycle records the chamber fill percentage at that moment, along with timestamp, compaction force applied, and cycle duration.
Over time, this data builds a picture of:
- Average fill rate (percentage per hour or per day)
- Peak generation periods (day of week, time of day)
- Compaction efficiency (how much volume reduction each cycle achieves)
- Full cycle frequency (how many cycles before the compactor bin is ready for collection)
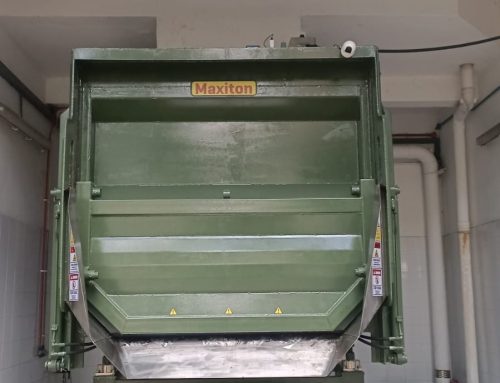
Maxiton’s IoT-compactor platform logs this data continuously and makes it available through the Maxiton Portal dashboard, accessible from any web browser or mobile device.
From Raw Data to Volume Forecasting
Raw fill-level readings are useful, but the real value comes from using that data to forecast future waste volumes. Here is the analytical progression most Singapore facilities follow:
Step 1: Establish a Baseline
The first four to six weeks after IoT installation provide a baseline. Facility managers learn what their actual average daily waste volume looks like — which is often significantly different from what they assumed based on collection truck driver reports or caretaker observations.
Step 2: Identify Patterns and Anomalies
With a baseline established, patterns emerge. Food courts typically peak on weekday lunches. Office towers spike on Monday mornings after a weekend. Retail malls show Friday afternoon surges. Anomaly detection flags unusual patterns — a sudden 40% spike in compactor cycles at a hotel may indicate a kitchen equipment issue or a change in food waste volume worth investigating.
Step 3: Dynamic Collection Scheduling
With accurate fill-rate data, waste collection contractors can be engaged on variable schedules rather than fixed weekly rounds. A property generating 80% of its weekly volume in the first three days no longer needs equal collection effort across all seven days. Dynamic scheduling typically reduces collection costs by 15–30% for IoT-equipped properties.
Step 4: Long-Term Capacity Planning
Quarterly and annual fill-level reports allow building managers to model waste growth trajectories. If volumes are trending upward by 8% per year, a facility manager can plan for a larger compactor or additional compactor units before the existing unit becomes a bottleneck. This avoids reactive procurement at premium prices.
Real-World Application: Singapore Office Tower Case Study
A 25-storey commercial office building in the CBD deployed four IoT-enabled waste compactors across its basement waste management room. Before IoT, the building operated on a fixed thrice-weekly collection schedule regardless of actual fill levels.
After six months of fill-level data collection, the facility manager discovered:
- Waste volumes on Mondays were 2.3x higher than Fridays — yet collections were evenly spread across the week
- Compactor 3 was generating 40% more cycles than the other three units despite similar foot traffic — a suspected leak in the compaction chamber was later confirmed and repaired
- Actual weekly waste volume was 18% lower than the contracted collection volume suggested, creating an opportunity to renegotiate the service contract
By switching to a data-driven collection schedule and renegotiating the contract, the building reduced its annual waste collection spend by approximately $14,000 — while eliminating overflow incidents entirely.
Integrating Fill-Level Data with Your BMS
For building managers pursuing BCA Green Mark certification or operating under smart building frameworks, fill-level data from waste compactors can be integrated into the broader Building Management System (BMS). This enables:
- Automated alerts when compactor fill levels approach 90% before end-of-day reporting cycles
- Energy consumption correlation (compactor power draw vs waste volume processed)
- Correlation with building occupancy data to validate waste-per-capita metrics
- Consolidated environmental reporting for Green Mark submissions
Maxiton’s engineering team provides BMS integration support for commercial properties undergoing smart building upgrades.
Choosing the Right IoT Platform for Volume Forecasting
Not all IoT waste monitoring platforms offer the same analytical depth. When evaluating platforms, facility managers in Singapore should look for:
- Historical data retention — at least 12 months of cycle-level data for meaningful trend analysis
- Export capability — CSV or API access for integration with facility management software
- Alert configurability — thresholds that match your property’s actual operational parameters, not generic defaults
- Multi-site support — for property managers overseeing multiple buildings, consolidated dashboards are essential
Explore Maxiton’s IoT waste monitoring solutions or speak to our team about a pilot programme at your property.